Free-Surface Piercing NACA 0024 Hydrofoil
From CFD-Wiki
Contents |
Introduction
This is a validation case for a 3-dimensional Volume of Fluid [Ref. 1] method.
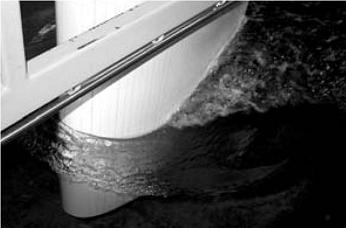
The above picture was taken from Ref. 2. It is a photograph of the experimental setup of the surface piercing foil. It shows a NACA 0024 profile with a chord of 1.2 m, which moves horizontally through the water at a velocity of 1.27 m/s. This situation corresponds to a Froude number of 0.37 and a Reynold’s number of 1.52E6. When the flow has evolved to a steady situation, the height of the free-surface is measured at a number of positions along the profile.
Mesh

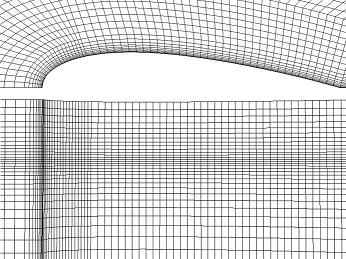
The mesh for this problem contains 118,800 cells. Because the problem is symmetric in the central vertical plane, I model only one half of the problem. The solution is time dependent. I monitor the drag coefficient on the profile to see when the problem has reached a stationary solution. I start with a flat free-surface and run the calculations on a coarse mesh. Then I use the solution of the coarse mesh as an initial solution for the fine mesh. For the fine mesh the cell width at the NACA boundary is 1.7 mm, resulting in a wall y+ = 52±17. This permits the application of a Standard Wall Function.
Results

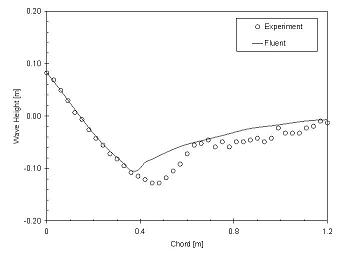
I compare the calculated wave height along the profile to that from the experiment [Ref. 2]. As can be seen in the figure above, the calculated solution is quite good except at the area around a chord of roughly 0.5 m. This is a well known difficulty and is related seperation, an effect responsible for the development of bubbles – see first figure – in that area.
The accuracy of the solution can be expressed by the Root Mean Squared (RMS) difference between experiment and calculation. For the coarse mesh the RMS = 0.0225, for the fine mesh it reduces to RMS = 0.0206. Since the solution becomes more accurate for the finer mesh, one can be confident that it at least part of the error could dissappear on an even finer mesh.
Finally, it should be noted that the drag coefficient does not reach a steady state but appears to oscillate with a frequency of roughly 1 Hz and an amplitude of roughly 1% of the mean value.
A possible improvement: The turbulence model was "k-epsilon" over the complete chordlength. Results might improve if a critical Reynold's point of Re=5E5 is set, and the model turned to "laminar" in the leading area.
References
[1] C.W. Hirt, B.D. Nichols, Volume of Fluid (VOF) Method for the Dynamics of Free Boundaries, J. Comp. Phys. 39, pp. 201-225 (1981)
[2] Shin Hyung Rhee, Boris P. Makarov, H. Krishinan, Vladimir Ivanov, Assessment of the volume of fluid method for free-surface wave flow, J. Mar. Sci. Technol. 10, pp. 173-180 (2005)
Appendix: Experimental Values
As found in Ref. 2:
Chord Experiment
0.00 0.082
0.03 0.069
0.06 0.049
0.09 0.029
0.12 0.007
0.15 -0.007
0.18 -0.026
0.21 -0.043
0.24 -0.056
0.27 -0.072
0.30 -0.082
0.33 -0.095
0.36 -0.108
0.39 -0.115
0.42 -0.121
0.45 -0.128
0.48 -0.128
0.51 -0.118
0.54 -0.105
0.57 -0.092
0.60 -0.072
0.63 -0.056
0.66 -0.052
0.69 -0.046
0.72 -0.059
0.75 -0.049
0.78 -0.059
0.81 -0.049
0.84 -0.049
0.87 -0.046
0.90 -0.043
0.93 -0.049
0.96 -0.043
0.99 -0.023
1.02 -0.033
1.05 -0.033
1.08 -0.033
1.11 -0.023
1.14 -0.020
1.17 -0.010
1.20 -0.013

